The Immigration Court Machine: How 100,000+ Cases a Month Became the New Normal
For most of the 2010s, immigration courts completed somewhere between 20,000 and 30,000 cases per month. The system was slow, overburdened, and perpetually behind, but it moved at a relatively predictable pace.
Between 2022 and 2025, that throughput roughly quadrupled. In 2024 alone, immigration courts completed 1.29 million cases, more than double the 487,000 completed in 2019 (EOIR data, Jan. 2026). In June 2025, a single month produced 160,767 completed cases (EOIR data) — a figure that would have represented more than six months of work a decade ago.
We pulled EOIR’s official case data — 12.4 million cases and 16.2 million proceedings, stretching from 2010 through January 2026 — to understand how this happened and what it means for the system going forward. What we found was that the surge in completions, while real, obscures a more complicated picture about what “completing a case” actually meant during this period.
A note on sources: All case completion, processing time, and outcome figures cited in this post are derived from EOIR’s monthly case data release, accessed through HammondLaw Immigration Database. Where we cite external reporting or government sources, those are linked individually.
A Decade in One Chart
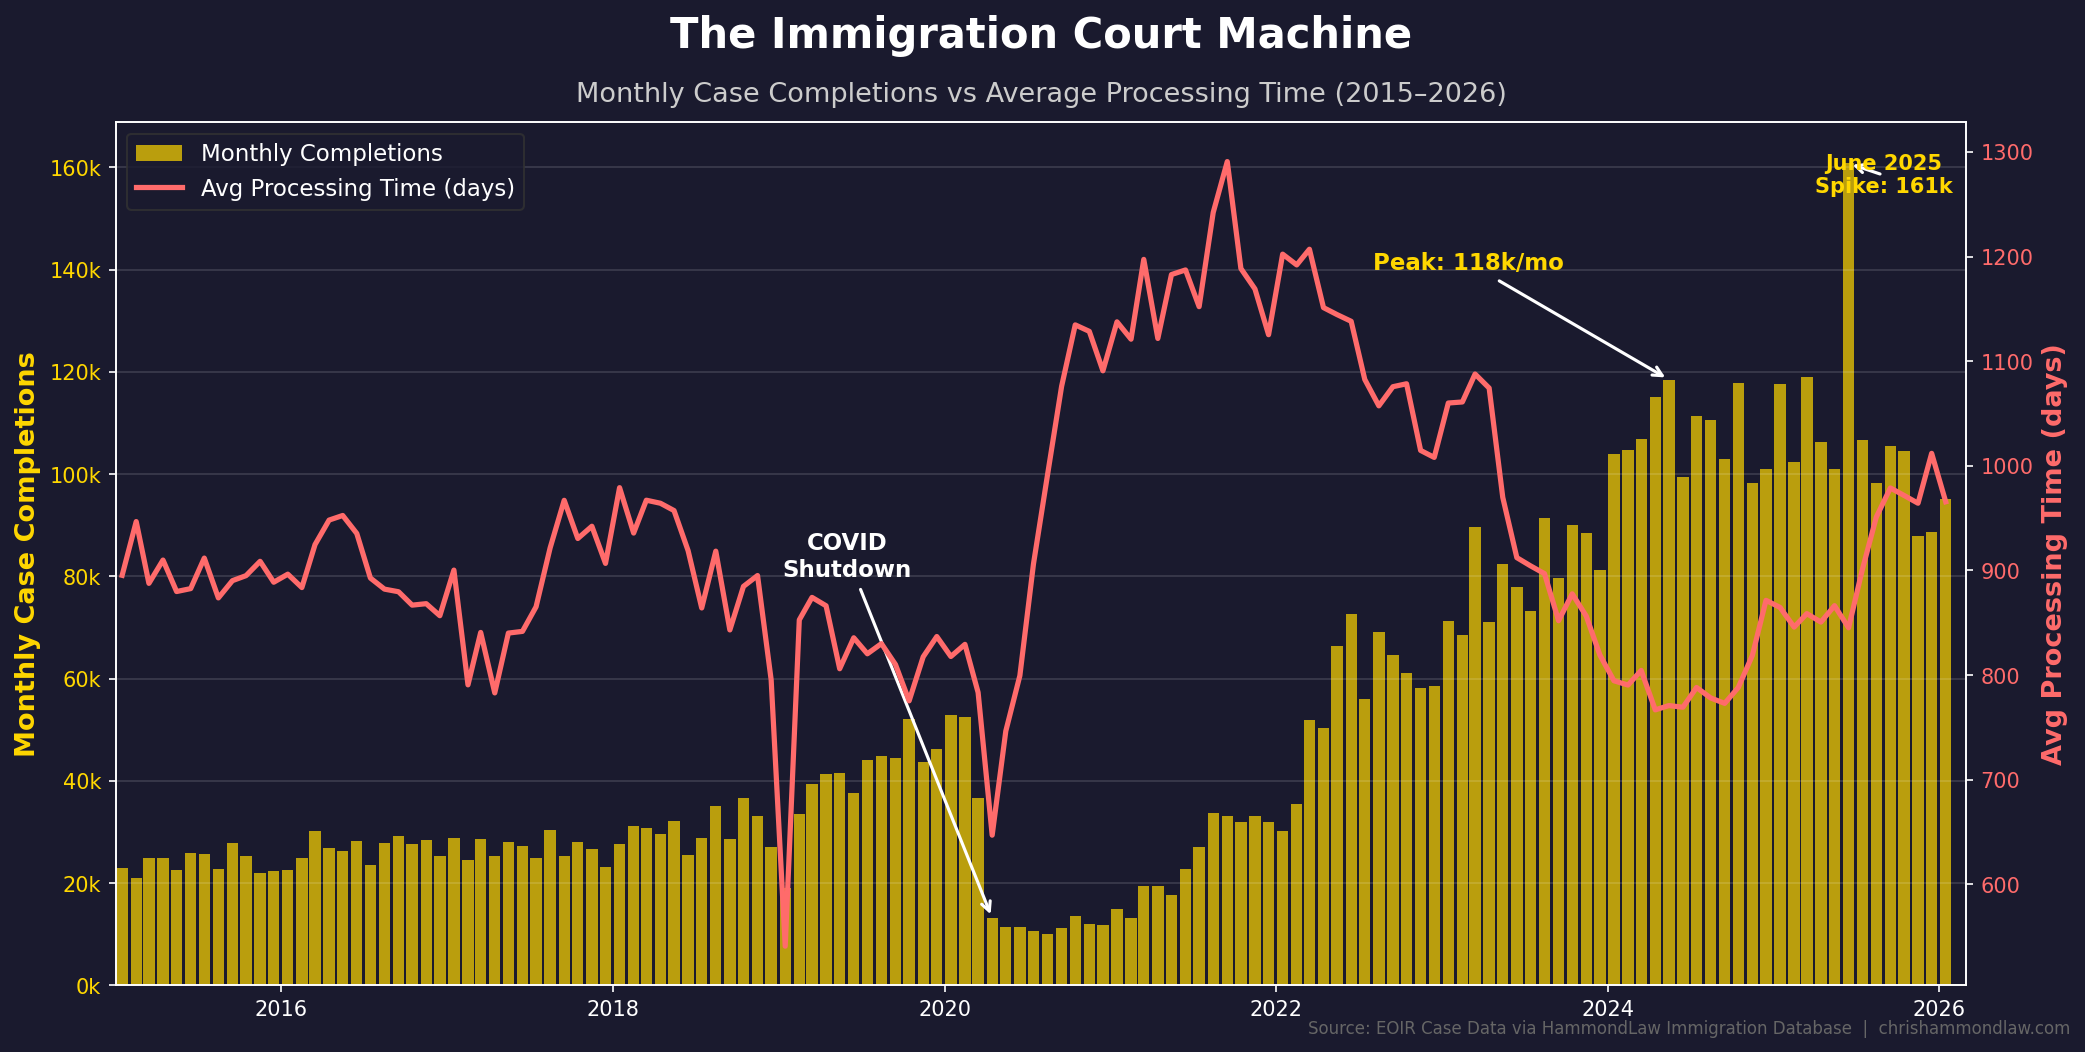
The gold bars show monthly case completions. The red line tracks average processing time — the number of days between a case’s Notice to Appear and its final disposition.
The COVID Collapse
When courts shut down in March 2020, monthly completions fell to around 10,000, a 60 percent decline from the months prior. They stayed in that range through the end of the year. For all of 2020, immigration courts completed just 247,000 cases. In 2021, still ramping back up, they managed 298,000.
With hearings postponed for months, cases that had already been pending for years continued to sit. The average completed case during this period had been in the system for over 1,290 days — roughly three and a half years from NTA to final order.
How the System Scaled Up
The ramp that followed was driven by several factors working in parallel.
Judicial hiring. The number of immigration judges on staff nearly tripled over the past decade, from 254 at the end of FY2015 to 735 at the end of FY2024, according to a Congressional Research Service analysis. EOIR hired 437 new judges in the last five fiscal years alone, including a record 104 in FY2022, per a separate CRS report.
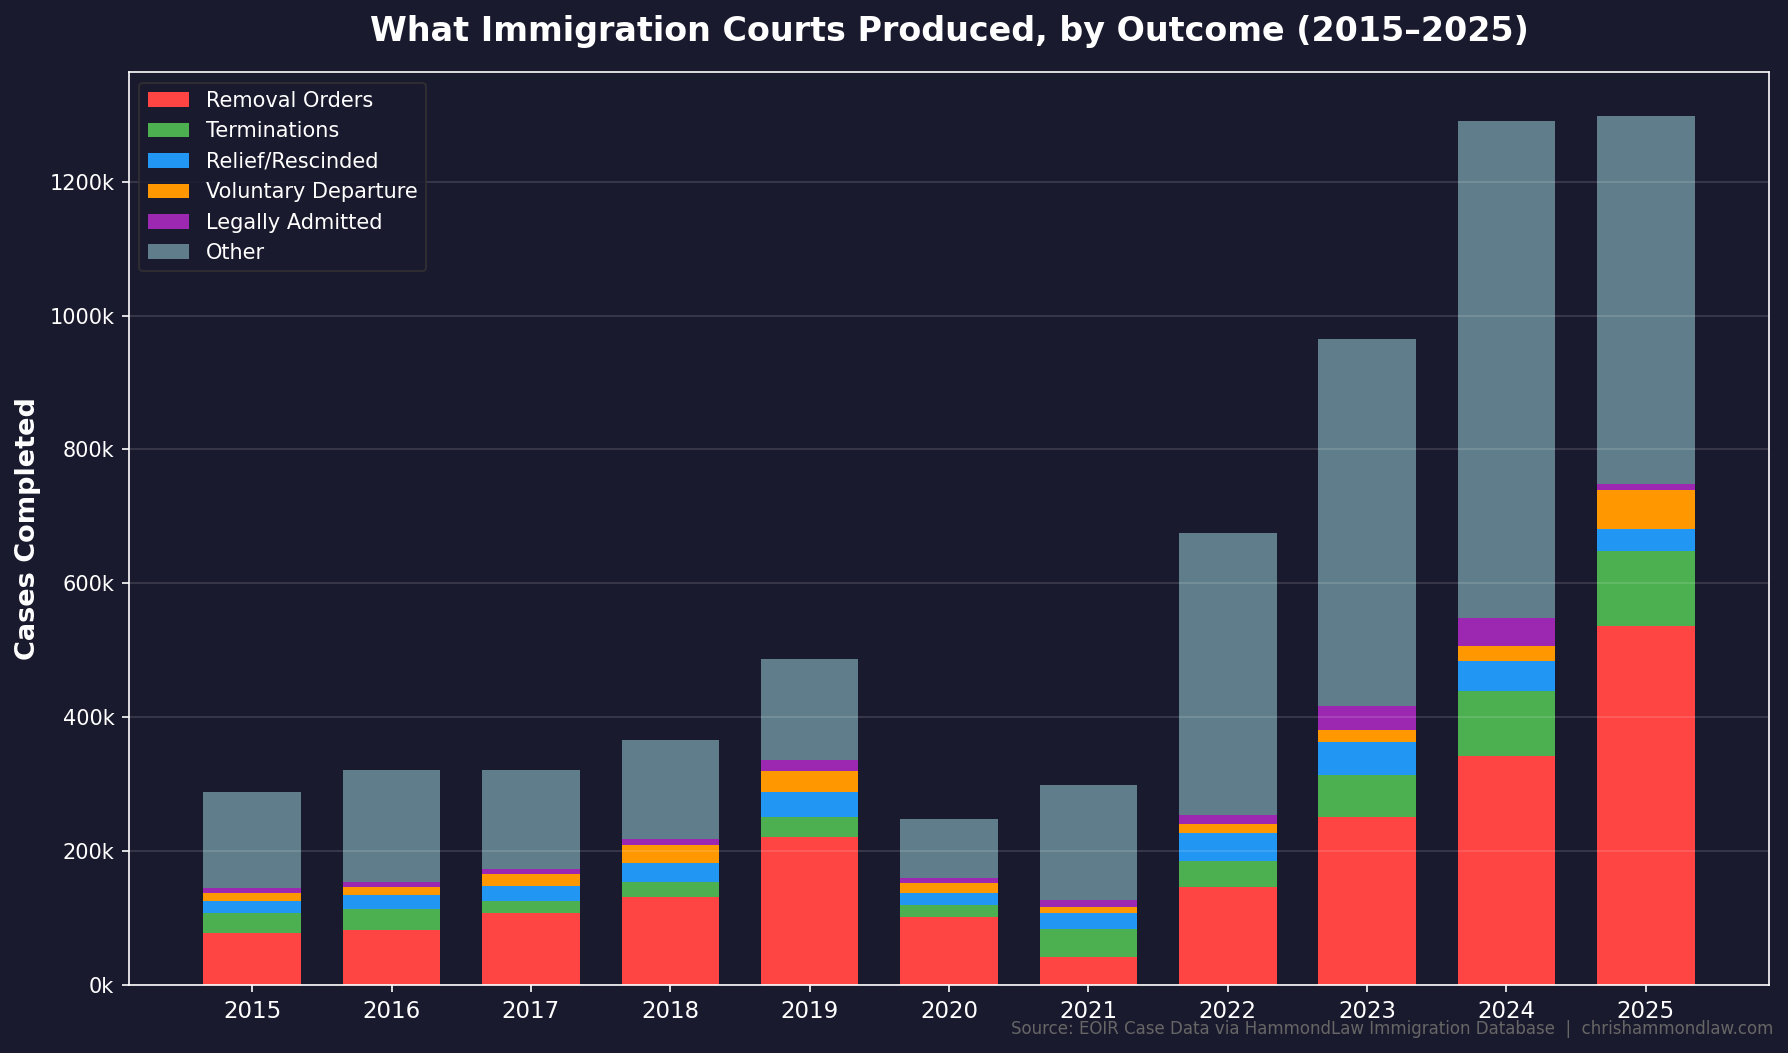
Removal orders. In 2019, immigration courts issued 221,000 removal orders. By 2025, that number had reached 535,000 — a 142 percent increase. Much of this growth came from in-absentia orders, where the respondent failed to appear and the judge entered a default removal. These cases move through the system in minutes rather than hours, and they inflate completion totals without a proportional increase in the demand on judicial time.
Case terminations. Terminations — cases closed by the judge without a decision on the merits — rose from 30,000 in 2019 to 113,000 in 2025. Administrative closures and prosecutorial discretion decisions can clear significant volumes from the docket without full hearings.
But there is a fourth factor buried in the data that turns out to be one of the largest drivers of the surge, and it has received relatively little attention.
The 648,000 Ghost Cases
In EOIR’s case data, there is a decision code — “U” — that carries no official description. It barely existed before 2021. Then, starting in April of that year, it began appearing at scale.
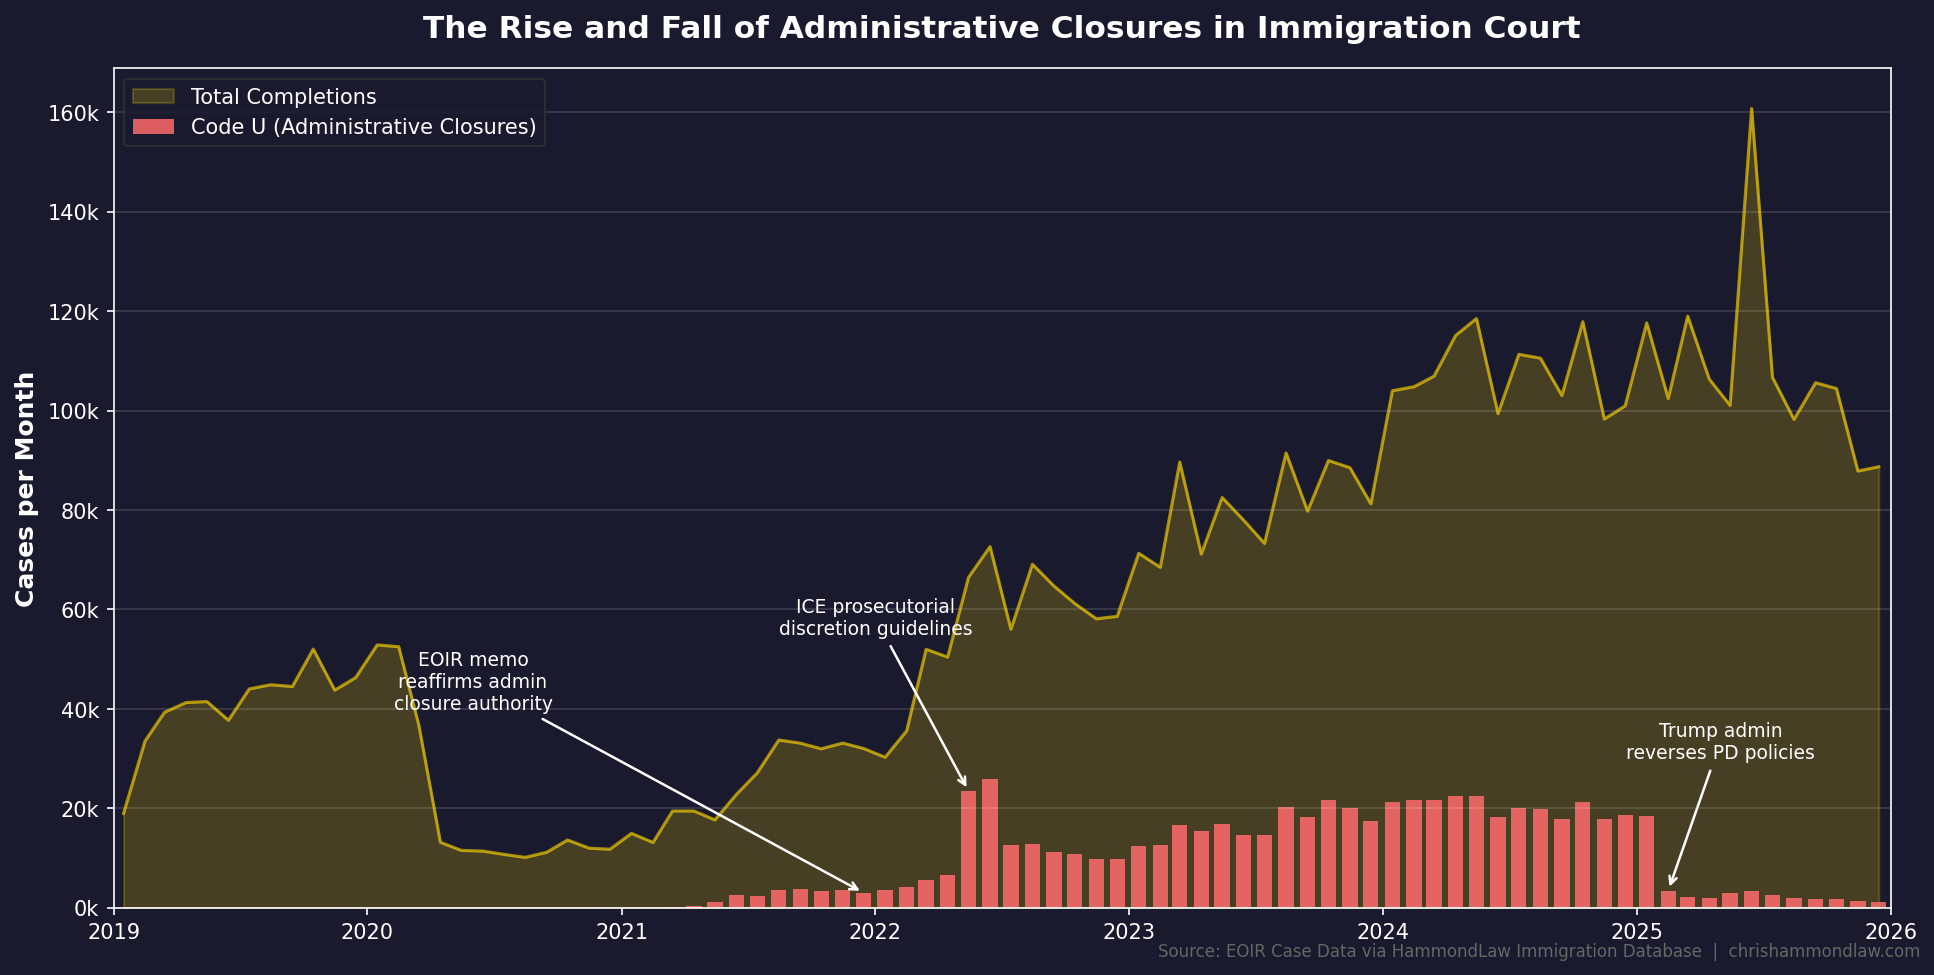
By May 2022, more than 23,000 cases per month were being completed under code U. Through 2023 and 2024, the number held steady at 15,000 to 22,000 per month. In total, approximately 648,000 cases have been closed under this code since it appeared — roughly 10 percent of all completions during the surge period.
The timing aligns precisely with a series of policy shifts. In December 2021, EOIR’s director issued a memo reaffirming immigration judges’ authority to administratively close cases and encouraging its use for non-priority respondents. In early 2022, ICE began exercising prosecutorial discretion at a significantly expanded scale, with ICE attorneys moving to dismiss or shelve cases that didn’t meet enforcement priorities.
The characteristics of code-U cases are distinctive. Their average processing time — measured from NTA to completion — runs between 2,000 and 3,000 days, or roughly six to eight years. These were old cases, many of them likely involving respondents who had been living in the United States for years with cases that had languished on the docket. Administrative closure removed them from the active calendar without a final decision on the merits. The cases were shelved, not adjudicated.
Then, in early 2025, code-U completions collapsed — from 18,000 per month in January to around 3,000 by February and 1,000-2,000 per month through the rest of the year. The second Trump administration reversed the prior administration’s prosecutorial discretion policies, and administrative closures largely stopped.
This matters for understanding the surge. A system that completed 1.29 million cases in 2024 sounds dramatically more productive than one that completed 487,000 in 2019. And it was more productive — the tripling of the judge corps alone guaranteed that. But roughly 243,000 of those 2024 completions were code-U administrative closures that involved no hearing, no merits determination, and no final order. Another substantial share were in-absentia removals processed in minutes. The actual increase in contested, on-the-merits adjudication was real but considerably smaller than the headline numbers suggest.
The Current Trajectory
Since the record month of June 2025, monthly completions have settled into the 88,000 to 95,000 range — still historically elevated, but noticeably below the 2024 peaks. The drop-off in administrative closures accounts for a meaningful portion of this decline.
The more consequential trend may be in processing times. After falling to approximately 770 days by mid-2024, the average has climbed back to 966 days as of January 2026, rising consistently over the past six months.
Part of the explanation is compositional. The backlog of straightforward cases — uncontested removals, abandoned applications, administratively closable files — has been substantially worked through. What remains tends to be more complex and more time-consuming.
But there is also a staffing problem. The number of judges on board dropped from 735 in FY2024 to 685 by Q3 of FY2025, a loss of 50 judges in less than a year. Since the beginning of the second Trump administration, more than 100 immigration judges — approximately 15 percent of the bench — have been fired, transferred, or taken a resignation offer, according to the Immigration Judge Union. The capacity gains built up through years of hiring are at risk of reversing.
Meanwhile, the backlog remains enormous. EOIR received nearly 1.8 million new cases in FY2024, and the pending caseload stood at 3.6 million at the end of that fiscal year. With administrative closures no longer available as a pressure valve and judicial ranks thinning, the system is completing cases more slowly than it is receiving them.
What This Means in Practice
Processing times are rising again. The average case now takes about two years and eight months from NTA to disposition, up from roughly two years and two months six months ago. The efficiency gains from the backlog push appear to be fading.
Hearing dates are still being scheduled faster than they were pre-COVID, given the larger bench. But the remaining backlog of 3.6 million cases, combined with a shrinking judge corps and the end of administrative closures as a docket management tool, suggests sustained strain for years to come.
And these are national averages. Processing times, grant rates, and outcome distributions vary widely by court location and by individual immigration judge. We’ll be publishing Houston-specific data in a future post.
Data: EOIR case data through January 2026, comprising 12.4 million cases and 16.2 million proceedings. Accessed via HammondLaw Immigration Database.
Chris Hammond is an immigration attorney in Houston, Texas. If you have questions about your case, schedule a consultation.
Related posts
- The Immigration Appeal Process is Changing
- Which Houston-Area Counties Have Signed Agreements to Cooperate with ICE?
- What Is an I-601A Waiver? A Guide to the Provisional Unlawful Presence Waiver