In January 2023, immigration courts granted some form of relief — asylum, cancellation of removal, withholding, and other protections — in roughly 25% of adjudicated cases. By January 2026, that number was 3.2%.
The decline happened in two phases. The first was a slow compression through 2024, driven largely by rising caseloads. The second was a collapse in early 2025 that has not reversed.
All data in this post comes from EOIR case records, analyzed via the HammondLaw Immigration Research Database. Relief rate is calculated as (A+R)/(A+R+X), where A = grants of admission, R = other relief or rescission, and X = removal orders. This excludes voluntary departure, terminations, and other administrative dispositions to isolate cases where a judge made a merits determination.
The Overall Trend
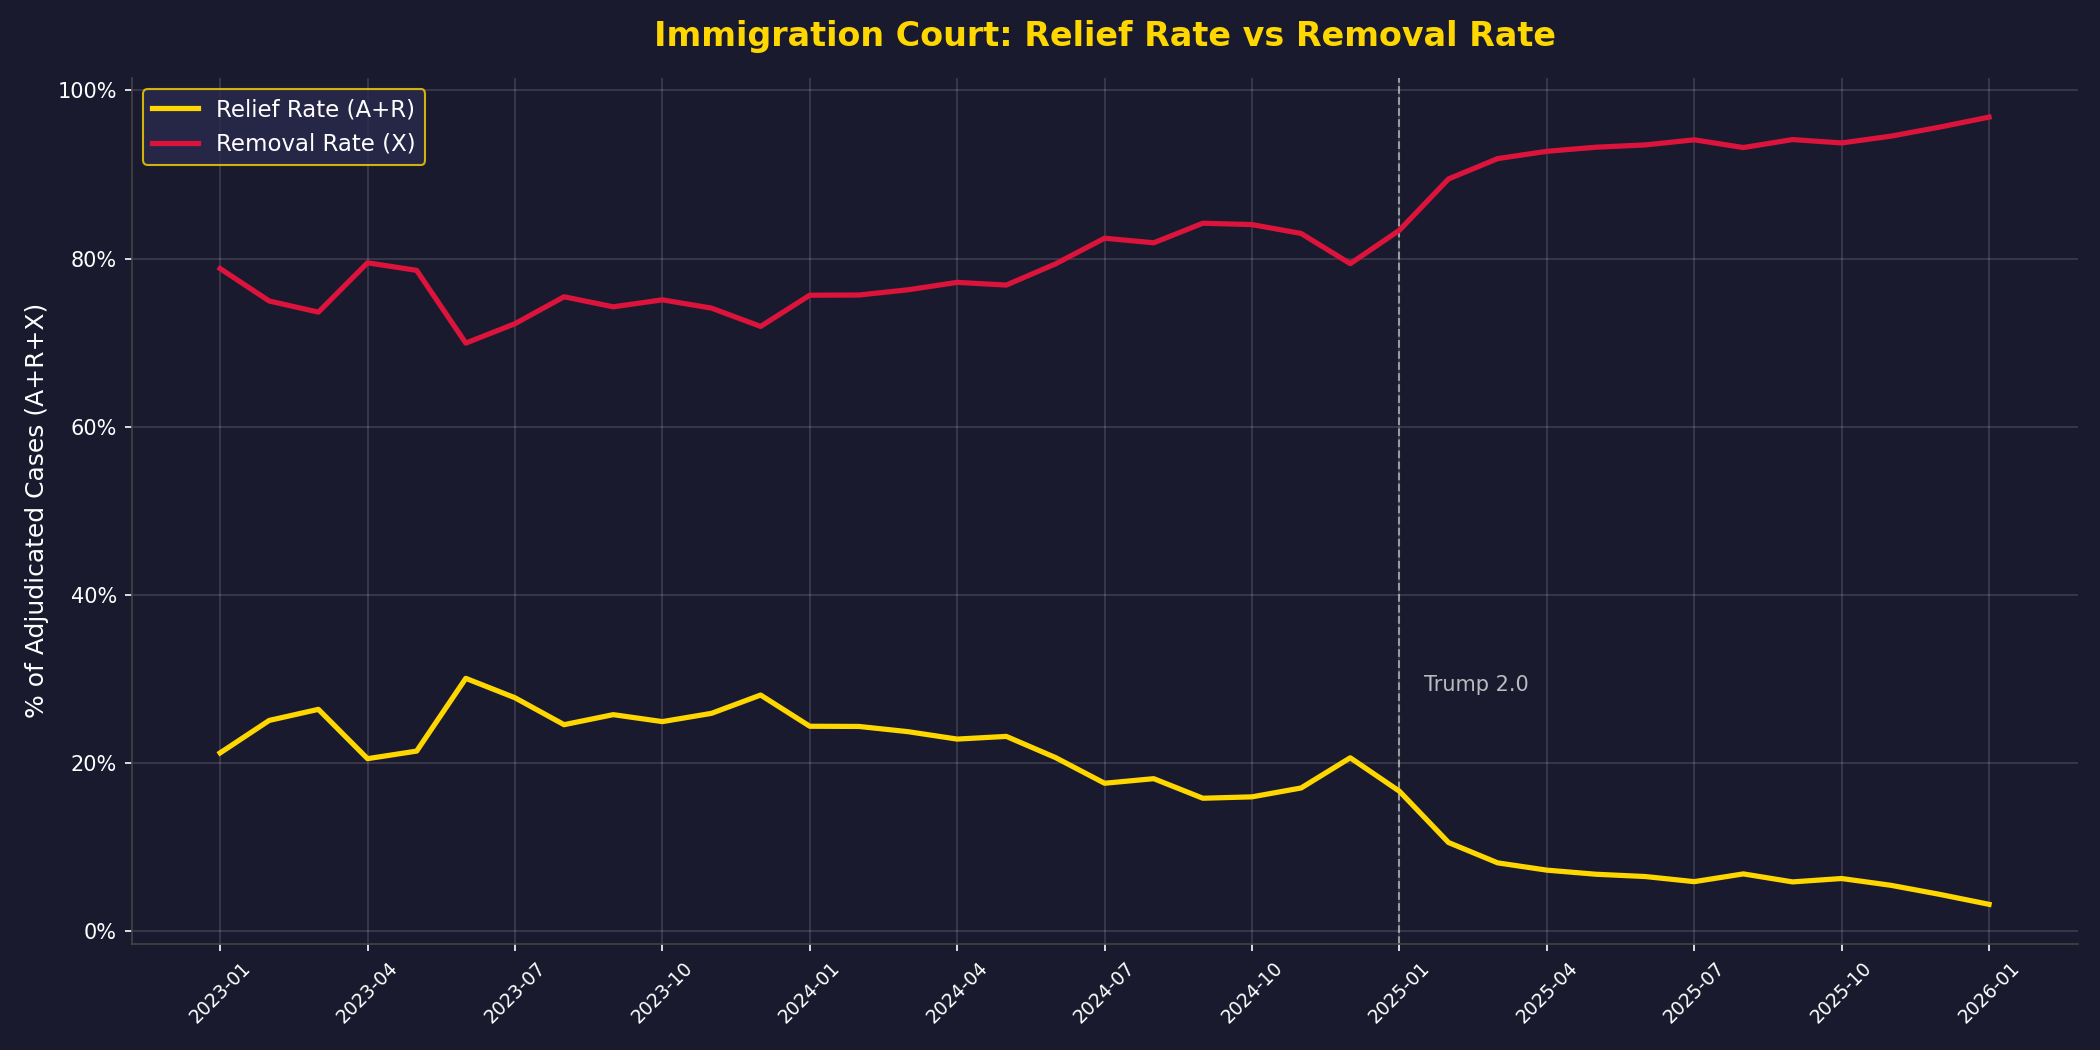
From January 2023 through mid-2024, immigration courts granted relief (EOIR decision categories A and R) in roughly 20-30% of adjudicated cases. The rate fluctuated month to month but stayed within a recognizable band. Removal orders (category X) accounted for the remainder.
Starting in mid-2024, the balance shifted. Relief rates dropped below 20% and kept falling. By January 2025, relief was at 16.6%. By February, 10.5%. By June, 6.5%. The most recent complete month, January 2026, shows 3.2%.
In raw numbers: 1,442 grants of relief (A + R combined). 43,919 removal orders.
Absolute Numbers
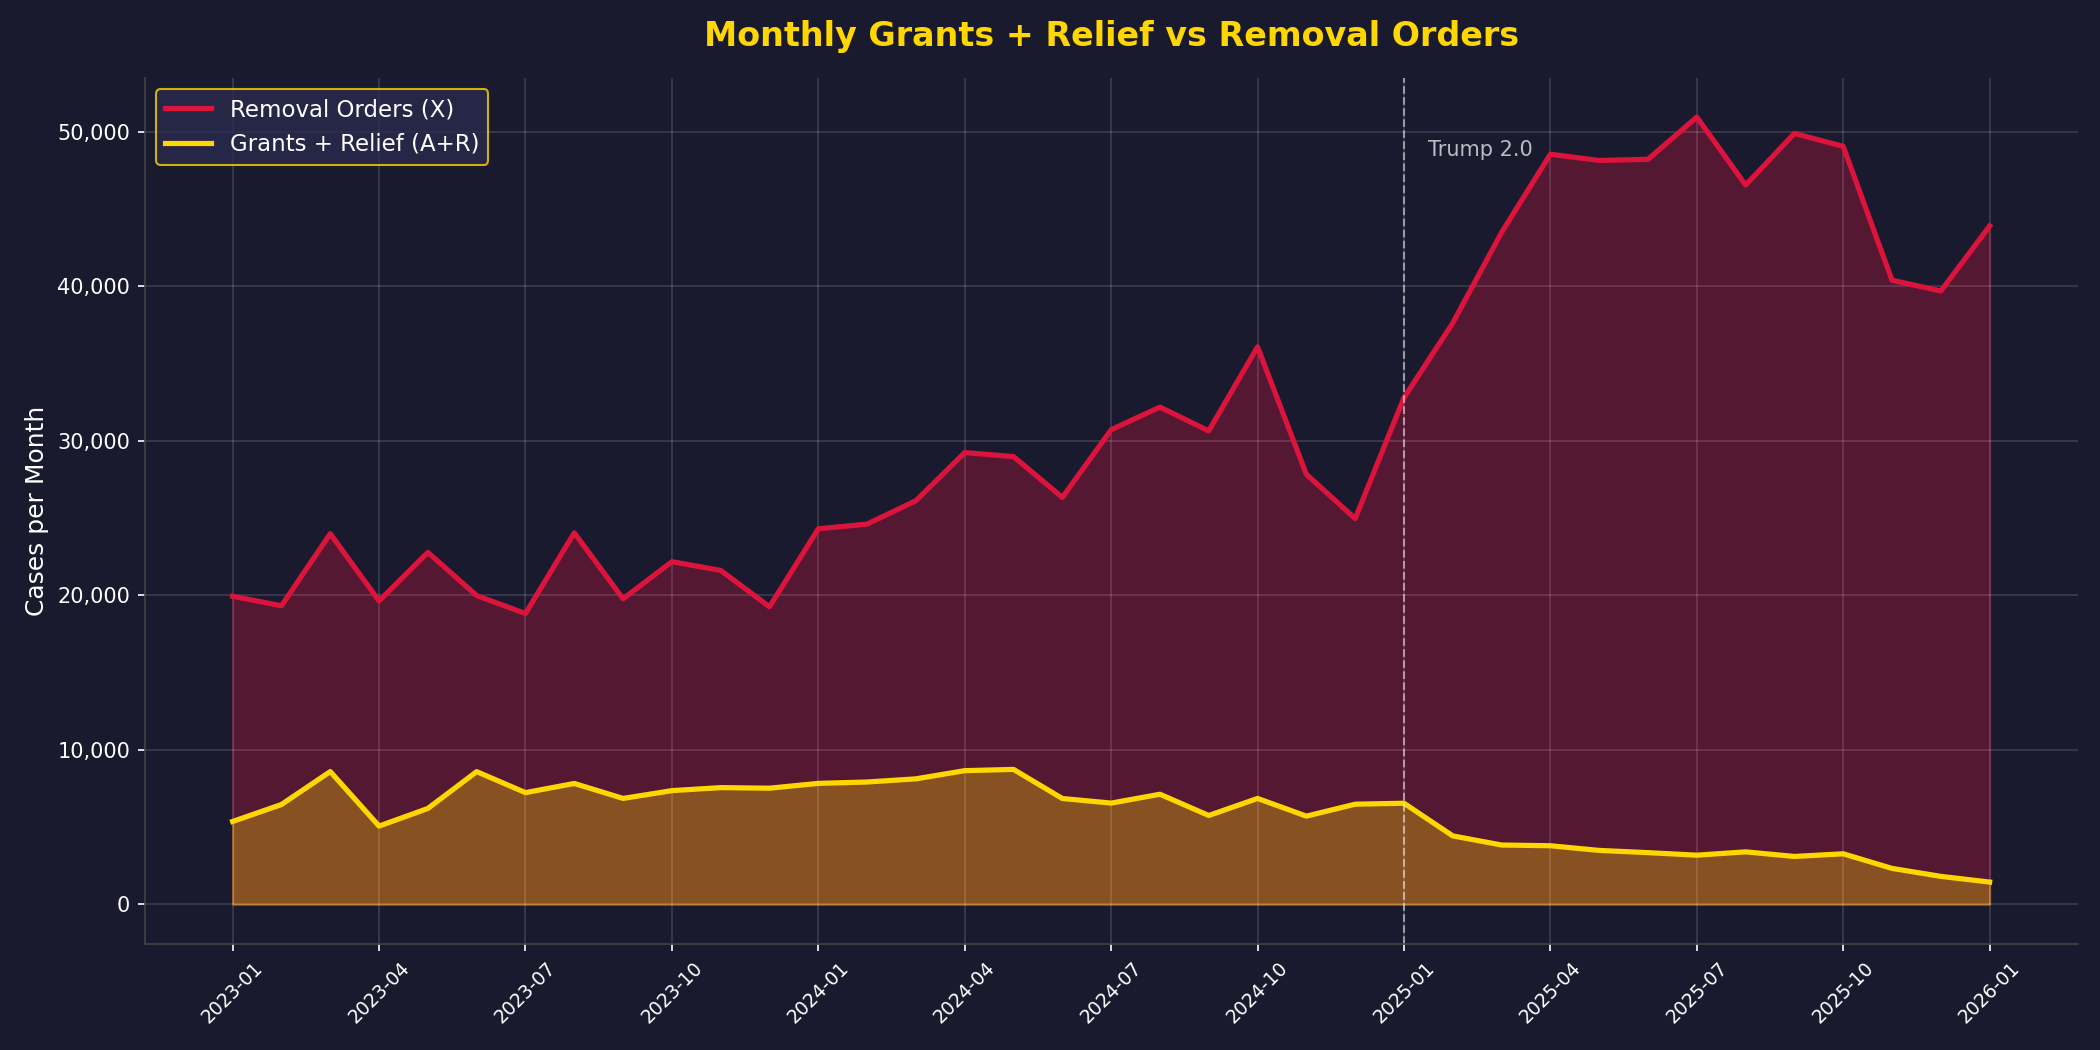
Through mid-2024, the relief rate declined mostly because the denominator grew. Courts processed more cases. Removal orders climbed from 20,000/month to over 30,000. Combined grants and relief held relatively steady around 5,000-8,000/month.
That changed in early 2025. Grants of admission (A) dropped from 2,839 in January to 1,060 in February to 369 in March. Other relief (R) also declined, from 3,706 in January 2025 to 1,024 by January 2026. Removal orders, meanwhile, surged past 40,000/month and peaked above 50,000 in July 2025.
Both the numerator and the denominator moved against respondents. Courts are processing far more cases and granting relief in far fewer of them.
By Nationality
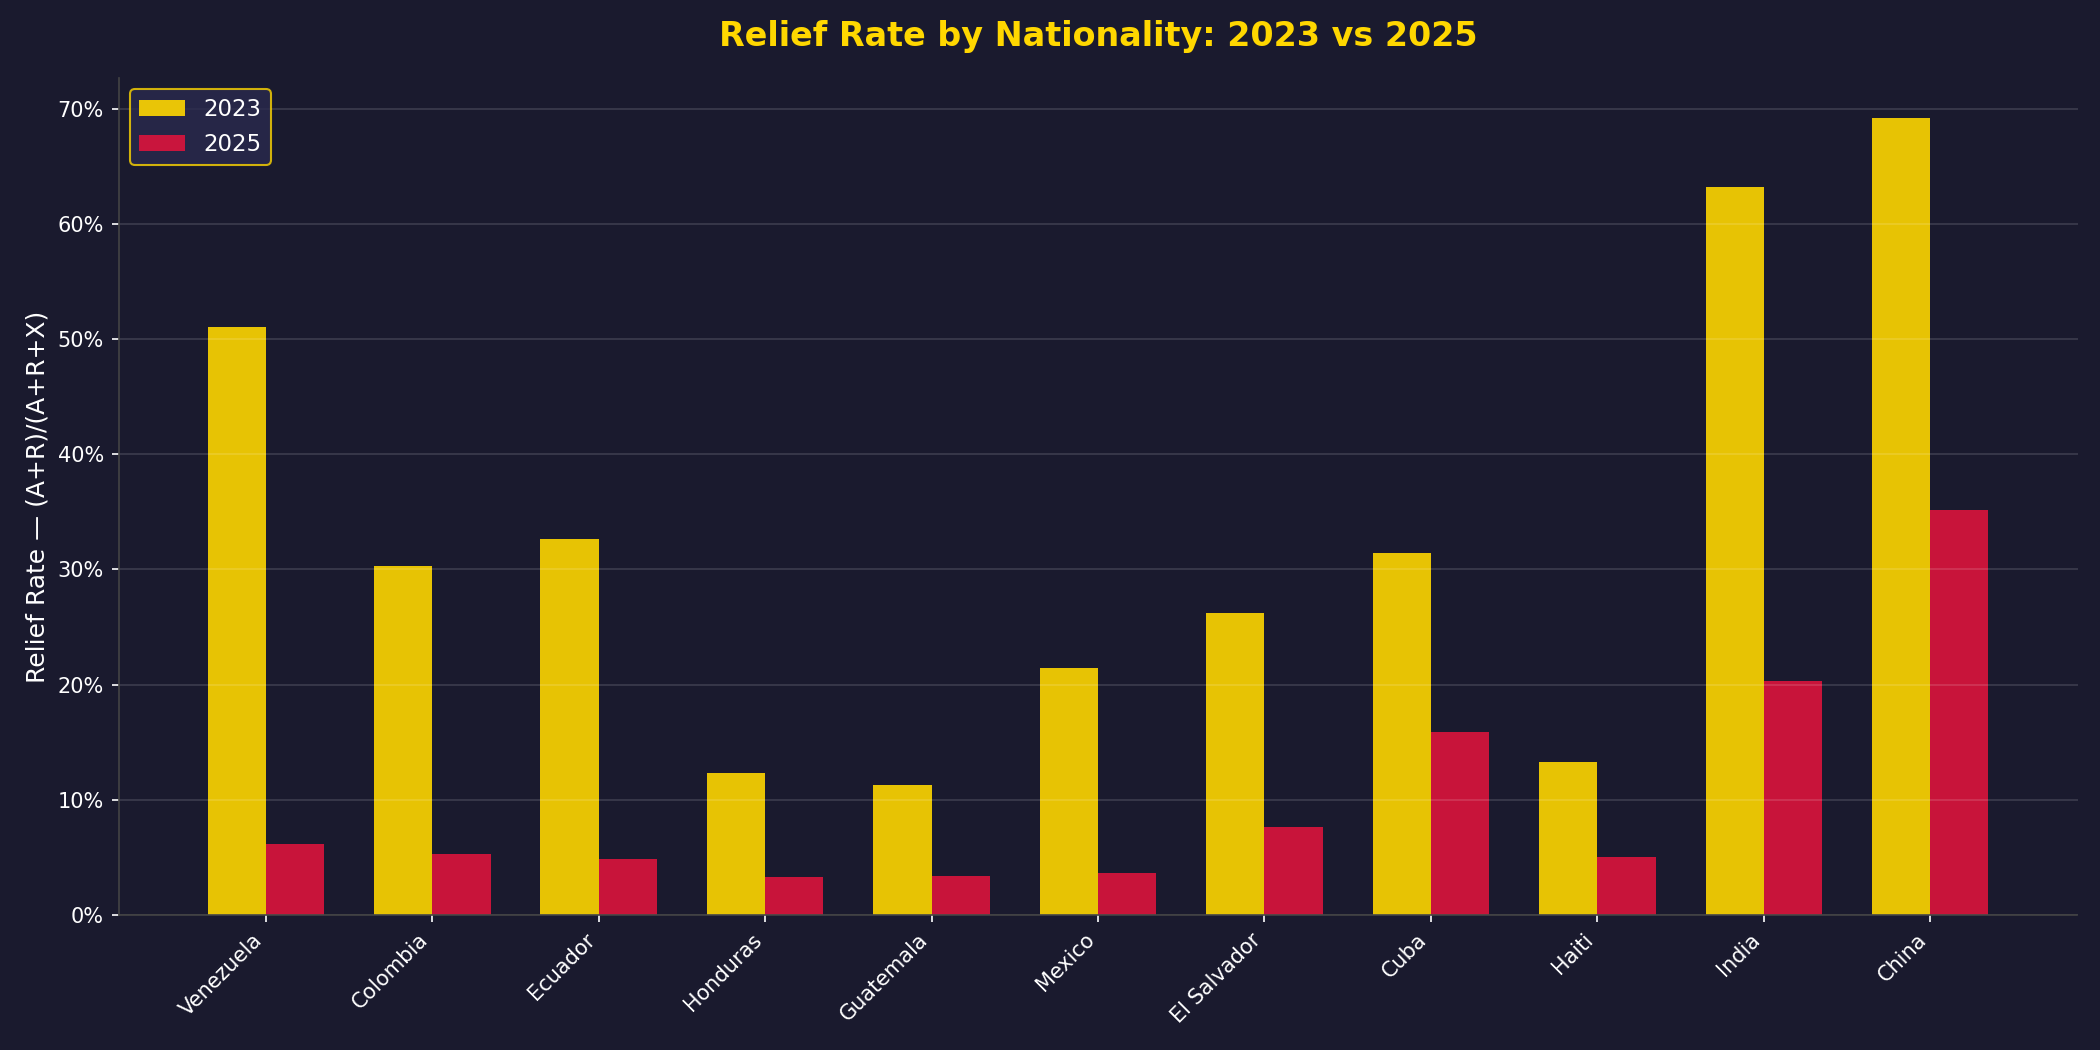
Every nationality saw declines. The distribution reveals two distinct patterns.
Nationalities with high 2023 baselines that collapsed. Chinese nationals went from a 69% relief rate to 35%. Indian nationals from 63% to 20%. These nationalities had high rates partly because a significant share of their cases resulted in other forms of relief (R), not just direct grants of admission. Even with that cushion, rates fell by half or more.
Latin American nationalities that converged toward zero. Venezuelan nationals went from 51% to 6.2%. Colombian cases from 30% to 5.3%. Ecuadorian from 33% to 4.9%. Cuban cases dropped from 31% to 16%. Salvadoran from 26% to 7.7%.
Central American nationalities fell from already lower baselines. Honduran cases went from 12% to 3.3%. Guatemalan from 11% to 3.4%. Mexican from 22% to 3.7%.
In 2023, Venezuelan asylum seekers had one of the highest relief rates of any Latin American nationality in immigration court. By 2025, their rate was within a few points of Honduran and Guatemalan nationals, who have historically faced the steepest odds.
Contributing Factors
Multiple forces are pushing in the same direction.
Judicial appointments and reassignments. The immigration bench has changed significantly under the current administration. New appointments, reassignments, and the expanded role of the BIA have shifted the overall disposition of the court system.
Narrower eligibility standards. Executive actions restricting asylum eligibility, transit country bars, and heightened credible fear standards have reduced the pool of cases that can succeed on the merits. Claims that were viable in 2023 may no longer qualify.
Increased volume and expedited dockets. Total decided cases rose from roughly 27,000/month in early 2023 to over 50,000/month in late 2025. Expedited dockets and dedicated dockets for recent border crossers produce higher removal rates.
Voluntary departure replacing contested hearings. Voluntary departure increased from about 1,500/month in early 2025 to over 8,000/month in January 2026. Some respondents who might have pursued relief are choosing voluntary departure instead, either because their cases have become unwinnable or because the consequences of a removal order have grown more severe under current enforcement priorities. Because voluntary departure is excluded from our relief rate calculation, this shift does not directly affect the numbers above, but it suggests the effective rate of favorable outcomes is even lower than 3.2% when all dispositions are considered.
The proposed asylum work permit rule adds further pressure. If finalized, asylum seekers would wait over a year for work authorization, with a pause mechanism that DHS estimates could freeze new applications for decades. Fewer people filing asylum claims means fewer cases that could result in grants of relief.
Practical Implications
For respondents in proceedings: grants of relief still happen. 1,442 people received them in January 2026. But the margin for evidentiary gaps or procedural weaknesses has effectively vanished. Thorough preparation is no longer optional.
For attorneys: the nationality-level data matters. Understanding which claims still succeed, in front of which judges, at which courts, is increasingly the difference between a winnable case and a futile one. The HammondLaw Immigration Research Database tracks relief rates at the judge, court, and nationality level.
We will continue publishing data analyses as the numbers develop.
Chris Hammond is a Houston immigration attorney. If you or a family member are facing removal proceedings, schedule a consultation.